echarty
Minimal R/Shiny Interface to ECharts.js

Use Case 2 - step-by-step tutorial
Building a clock using echarty’s Translation Assistant
Watching the time go by? A little gem from ECharts examples can help - a finely crafted classical clock.
Looking at the JS code, we see the usual ‘option’, but also some functions at the bottom. And that’s a lot to rewrite in R! Fortunately, there is a better way:
Introducing the Echarty Translator Assistant (TA) - run the following R command
demo(js2r, package='echarty')
It is a R/Shiny app to help translate data from JS examples to R. Take a moment to familiarize yourself with it and check the Info button upper right.
We copy only the option object from ECharts and paste it in TA, then hit Translate and Plot … and get an error. This is due to the existance of a formatter component. We need to find it in R code and replace formatter=function…)),anchor with formatter=”@@”),anchor.
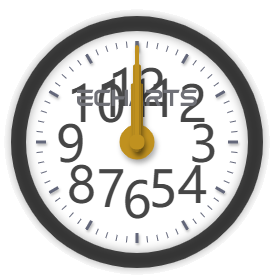
Try Plot to R again, we should get the following image

Better than nothing. Now lets get the original JS function from ECharts and put it back in the formatter the right way. The text is here:
function (value) { if (value === 0) { return ''; } return value; }
We need to enclose it in a special function so it could be carried to JS for execution.
htmlwidgets::JS("function (value) {
  if (value === 0) { return ''; } return value; }")
In R code replace formatter=”@@” with formatter=<above code> and plot.
We see numbers now, how wonderful ! Clock is not ticking yet because we still have not applied the JS functions.
From ECharts code, copy only text from “var timeUpdatedStatus…” to the end, and copy it in your text editor. After making sure there are no double quotes, enclose everything in double quotes and set it as an R string, like jcode<-”…”.
Next step is to look for two ECharts objects which have different names in our R environment. Replace myChart with chart, and option with opts. Now select/copy the entire text and paste it on top of R code before p <- ec.init.
Then replace p <- ec.init() with p <- ec.init(js=jcode) to load the JS code in echarty. Cross fingers and hit Plot to R again…
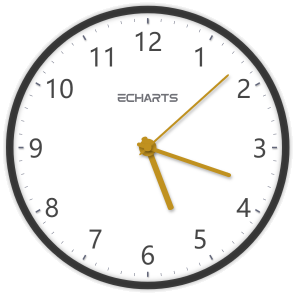
Let the good times R-R-R-Rolex ™ 👍
Once you learn those R-to-JS interaction steps, you can dance with any Echart.
Here is the complete R code
jcode <- "
var timeUpdatedStatus = {
  second: false,
  minute: false,
  hour: false
};
function updateSeries(time, series, type) {
  var isCritical = (Math.floor(time) === 0) || (type === 'second' && time === 1);
  if (isCritical && timeUpdatedStatus[type] === true) {
    timeUpdatedStatus[type] = false;
    series.data[0].value = 0;
    series.clockwise = true;
    opts.animationDurationUpdate = 0;
    chart.setOption(opts, true);
  }
  series.data[0].value = time;
  series.clockwise = true;
  if (time === 0) {
    timeUpdatedStatus[type] = true;
    series.clockwise = false;
  }
}
setInterval(function () {
  var date = new Date();
  var second = date.getSeconds();
  var minute = date.getMinutes() + second / 60;
  var hour = date.getHours() % 12 + minute / 60;

  updateSeries(second, opts.series[2], 'second');
  updateSeries(minute, opts.series[1], 'minute');
  updateSeries(hour, opts.series[0], 'hour');

  opts.animationDurationUpdate = 300;
  chart.setOption(opts, true);
  date = null;
}, 1000);"

ec.init(js= jcode, preset= FALSE,
	series= list(
	list(name= 'hour', type='gauge',startAngle=90,endAngle=-270,min=0,max=12,splitNumber=12,
		axisLine= list(lineStyle=list(width=15,color=list(list(1, 'rgba(0,0,0,0.7)')), shadowColor='rgba(0, 0, 0, 0.5)',shadowBlur=15)),
		splitLine= list(lineStyle=list(shadowColor='rgba(0, 0, 0, 0.3)',shadowBlur=3,shadowOffsetX=1,shadowOffsetY=2)),
		axisLabel= list(fontSize=50,distance=25,
			formatter=htmlwidgets::JS("function (value) {
                       if (value === 0) return ''; return value; }")
		),
		anchor= list(show=TRUE,icon='path://M532.8,70.8C532.8,70.8,532.8,70.8,532.8,70.8L532.8,70.8C532.7,70.8,532.8,70.8,532.8,70.8z M456.1,49.6c-2.2-6.2-8.1-10.6-15-10.6h-37.5v10.6h37.5l0,0c2.9,0,5.3,2.4,5.3,5.3c0,2.9-2.4,5.3-5.3,5.3v0h-22.5c-1.5,0.1-3,0.4-4.3,0.9c-4.5,1.6-8.1,5.2-9.7,9.8c-0.6,1.7-0.9,3.4-0.9,5.3v16h10.6v-16l0,0l0,0c0-2.7,2.1-5,4.7-5.3h10.3l10.4,21.2h11.8l-10.4-21.2h0c6.9,0,12.8-4.4,15-10.6c0.6-1.7,0.9-3.5,0.9-5.3C457,53,456.7,51.2,456.1,49.6z M388.9,92.1h11.3L381,39h-3.6h-11.3L346.8,92v0h11.3l3.9-10.7h7.3h7.7l3.9-10.6h-7.7h-7.3l7.7-21.2v0L388.9,92.1z M301,38.9h-10.6v53.1H301V70.8h28.4l3.7-10.6H301V38.9zM333.2,38.9v10.6v10.7v31.9h10.6V38.9H333.2z M249.5,81.4L249.5,81.4L249.5,81.4c-2.9,0-5.3-2.4-5.3-5.3h0V54.9h0l0,0c0-2.9,2.4-5.3,5.3-5.3l0,0l0,0h33.6l3.9-10.6h-37.5c-1.9,0-3.6,0.3-5.3,0.9c-4.5,1.6-8.1,5.2-9.7,9.7c-0.6,1.7-0.9,3.5-0.9,5.3l0,0v21.3c0,1.9,0.3,3.6,0.9,5.3c1.6,4.5,5.2,8.1,9.7,9.7c1.7,0.6,3.5,0.9,5.3,0.9h33.6l3.9-10.6H249.5z M176.8,38.9v10.6h49.6l3.9-10.6H176.8z M192.7,81.4L192.7,81.4L192.7,81.4c-2.9,0-5.3-2.4-5.3-5.3l0,0v-5.3h38.9l3.9-10.6h-53.4v10.6v5.3l0,0c0,1.9,0.3,3.6,0.9,5.3c1.6,4.5,5.2,8.1,9.7,9.7c1.7,0.6,3.4,0.9,5.3,0.9h23.4h10.2l3.9-10.6l0,0H192.7z M460.1,38.9v10.6h21.4v42.5h10.6V49.6h17.5l3.8-10.6H460.1z M541.6,68.2c-0.2,0.1-0.4,0.3-0.7,0.4C541.1,68.4,541.4,68.3,541.6,68.2L541.6,68.2z M554.3,60.2h-21.6v0l0,0c-2.9,0-5.3-2.4-5.3-5.3c0-2.9,2.4-5.3,5.3-5.3l0,0l0,0h33.6l3.8-10.6h-37.5l0,0c-6.9,0-12.8,4.4-15,10.6c-0.6,1.7-0.9,3.5-0.9,5.3c0,1.9,0.3,3.7,0.9,5.3c2.2,6.2,8.1,10.6,15,10.6h21.6l0,0c2.9,0,5.3,2.4,5.3,5.3c0,2.9-2.4,5.3-5.3,5.3l0,0h-37.5v10.6h37.5c6.9,0,12.8-4.4,15-10.6c0.6-1.7,0.9-3.5,0.9-5.3c0-1.9-0.3-3.7-0.9-5.3C567.2,64.6,561.3,60.2,554.3,60.2z',
			  			 	 showAbove=FALSE,offsetCenter=list(0, '-35%'),size=120,keepAspect=TRUE,itemStyle=list(color='#707177')),
		pointer=list(icon='path://M2.9,0.7L2.9,0.7c1.4,0,2.6,1.2,2.6,2.6v115c0,1.4-1.2,2.6-2.6,2.6l0,0c-1.4,0-2.6-1.2-2.6-2.6V3.3C0.3,1.9,1.4,0.7,2.9,0.7z',width=12,length='55%',offsetCenter=list(0, '8%'),itemStyle=list(color='#C0911F',shadowColor='rgba(0, 0, 0, 0.3)',shadowBlur=8,shadowOffsetX=2,shadowOffsetY=4)),detail=list(show=FALSE),title=list(offsetCenter=list(0, '30%')),data=list(list(value=0))
	),
	list(name= 'minute', type='gauge',startAngle=90,endAngle=-270,min=0,max=60,
	  axisLine= list(show=FALSE),splitLine=list(show=FALSE),axisTick=list(show=FALSE),
	  axisLabel= list(show=FALSE), pointer=list(icon='path://M2.9,0.7L2.9,0.7c1.4,0,2.6,1.2,2.6,2.6v115c0,1.4-1.2,2.6-2.6,2.6l0,0c-1.4,0-2.6-1.2-2.6-2.6V3.3C0.3,1.9,1.4,0.7,2.9,0.7z',width=8,length='70%',offsetCenter=list(0, '8%'),itemStyle=list(color='#C0911F',shadowColor='rgba(0, 0, 0, 0.3)',shadowBlur=8,shadowOffsetX=2,shadowOffsetY=4)),
	  anchor= list(show=TRUE,size=20,showAbove=FALSE,itemStyle=list(borderWidth=15,borderColor='#C0911F',shadowColor='rgba(0, 0, 0, 0.3)',shadowBlur=8,shadowOffsetX=2,shadowOffsetY=4)),detail=list(show=FALSE),title=list(offsetCenter=list('0%', '-40%')),data=list(list(value=0))),
	list(name= 'second', type='gauge',startAngle=90,endAngle=-270,min=0,max=60,animationEasingUpdate='bounceOut',
	  axisLine= list(show=FALSE),splitLine=list(show=FALSE),axisTick=list(show=FALSE),
	  axisLabel= list(show=FALSE), pointer=list(icon='path://M2.9,0.7L2.9,0.7c1.4,0,2.6,1.2,2.6,2.6v115c0,1.4-1.2,2.6-2.6,2.6l0,0c-1.4,0-2.6-1.2-2.6-2.6V3.3C0.3,1.9,1.4,0.7,2.9,0.7z',width=4,length='85%',offsetCenter=list(0, '8%'),itemStyle=list(color='#C0911F',shadowColor='rgba(0, 0, 0, 0.3)',shadowBlur=8,shadowOffsetX=2,shadowOffsetY=4)),
	  anchor= list(show=TRUE,size=15,showAbove=TRUE,itemStyle=list(color='#C0911F',shadowColor='rgba(0, 0, 0, 0.3)',shadowBlur=8,shadowOffsetX=2,shadowOffsetY=4)),detail=list(show=FALSE),title=list(offsetCenter=list('0%', '-40%')),data=list(list(value=0)))
	)
)