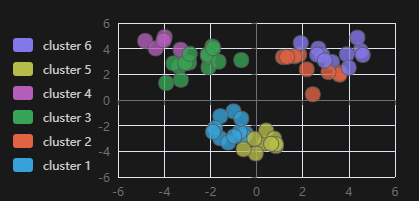
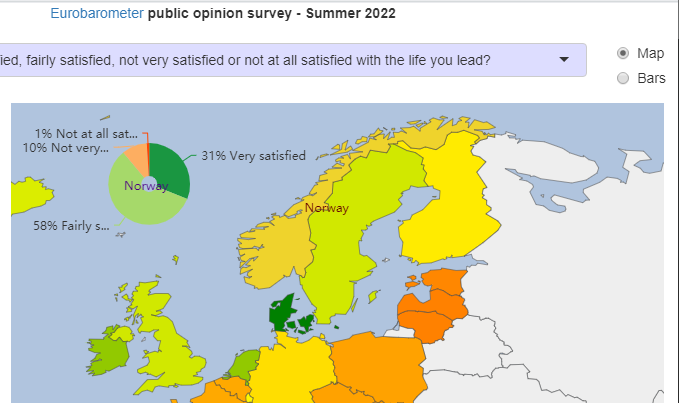
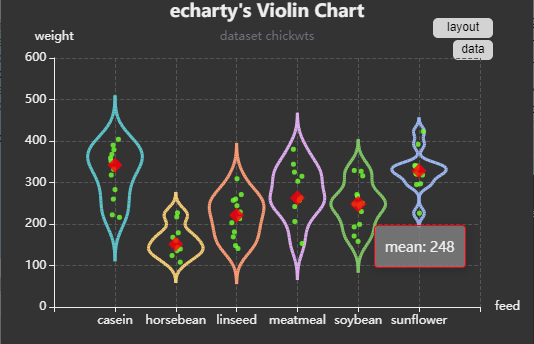
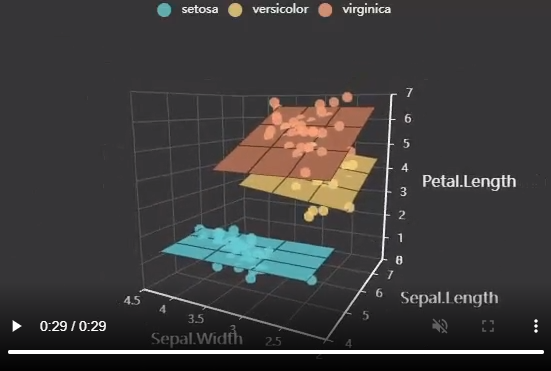
A collection of charts with their source code
showing usage of echarty. Some Live Demos are hosted on RPubs.
This page is searchable if you are interested in a specific
keyword.
The package itself has two dozen more code examples - type
?ec.examples to see them.
Single-page web hosting
Edit R-code and run charts inside a web page - Live Demo
Real-Time Data charts with echarty - Live Demo
Data models
how to store data in echarty - Live Demo with code
Simple bar
demo for presets
knitr::opts_chunk$set(collapse=TRUE)

df <- data.frame(date= seq(as.Date('2019-12-25'), as.Date('2020-01-07'), by='day'), num= runif(14))

#  with presets and df chained
df |> ec.init(ctype= 'bar') |> ec.theme('dark')
#  without presets all options are explicitly assigned
ec.init(preset= FALSE,
  yAxis= list(show= TRUE),
  xAxis= list(type= 'category',
         axisLabel= list(interval= 0, rotate= 45) ),
  series= list(list(type= 'bar', data= ec.data(df)))
) |> ec.theme('dark')
Horizontal bars
with grouping
df <- Orange |> mutate(Tree= as.character(Tree)) |>
   arrange(Tree) |> group_by(Tree) |> group_split()

ec.init(preset= FALSE,
   series= lapply(df, function(t) {
      list(type= 'bar', name= unique(t$Tree), data= t$circumference) }),
   legend= list(show=TRUE),
   xAxis= list(name= 'tree circumference in mm', nameLocation= 'center', nameGap= 22),
   yAxis= list(data= unique(Orange$age), name= 'age in days'),
   tooltip= list(formatter= 'circumference={c} mm')
) |> ec.upd({
   l <- length(series)
   series[[l]]$name <- paste(series[[l]]$name, ' trees')
}) |> ec.theme('dark')
Easy as pie
library(echarty); library(dplyr)
isl <- data.frame(name= names(islands), value= islands) |> filter(value>60) |> arrange(value)

ec.init(preset= FALSE,
   title= list(text= "Landmasses over 60,000 mi\u00B2", left= 'center'),
   tooltip= list(show= TRUE),
   series= list(list(type= 'pie', data= ec.data(isl, 'names'))),
   backgroundColor= '#191919'
)
Parallel chart
library(echarty); library(dplyr)
iris |> group_by(Species) |>
   ec.init(ctype='parallel', color= rainbow(10)) |>
   ec.upd({   # update preset series
      series <- lapply(series, function(s) {
         s$smooth <- TRUE
         s$lineStyle <- list(width=3)
         s })
   }) |> ec.theme('dark-mushroom')
Custom chart
# source https://echarts.apache.org/examples/en/editor.html?c=custom-profit
# GUI translated with demo(js2r) with rdata and ritem added

library(echarty); library(dplyr)
data <- list(list(10, 16, 3, "A"), list(16, 18, 15, "B"), list(18, 26, 12, "C"),
             list(26, 32, 22, "D"), list(32, 56, 7, "E"), list(56, 62, 17, "F"))
colorList <- c("#4f81bd", "#c0504d", "#9bbb59", "#604a7b", "#948a54", "#e46c0b")
rdata <- lapply(1:6, \(x) {
   list(value= data[[x]],
       itemStyle= list(color= colorList[x])) })
ritem <- "function renderItem(params, api) {
    var yValue= api.value(2);
    var start= api.coord([api.value(0), yValue]);
    var size= api.size([api.value(1) - api.value(0), yValue]);
    var style= api.style();

    return {
        type: 'rect',
        shape: {
            x: start[0],
            y: start[1],
            width: size[0],
            height: size[1]
        },
        style: style
    };
}"
ec.init(
   title= list(text= "Profit", left= "center"),
   tooltip= list(show=T),
   xAxis= list(scale= TRUE), yAxis= list(show= T),
   series= list(list(type= "custom",
      renderItem= htmlwidgets::JS(ritem),
      label= list(show= TRUE, position= "top"),
      dimensions= list("from", "to", "profit"),
      encode= list(x= list(0, 1), y= 2,
      tooltip= list(0, 1, 2), itemName= 3),
      data= rdata ))
) |> ec.theme('dark-mushroom')
Error Bars
set.seed(222)  # --------- 10 categories
df <- sleep |> mutate(
    low=  round(extra-0.7*runif(20),3),
    high= round(extra+0.7*runif(20),3)) |> group_by(ID)
ec.init(df, ctype='bar', load='custom',
    series.param= list(
          encode= list(x='group', y='extra')) ) |>
ecr.ebars(encode= list(x='group', y=c('extra','low','high')) )
Lollypop chart
A fusion of bar and scatter charts
library(echarty); library(dplyr)
df <- mtcars
df$mpg_z <- round((df$mpg -mean(df$mpg))/sd(df$mpg), 1)   # deviation
df |> tibble::rownames_to_column("model") |>
relocate(model,mpg_z) |> arrange(desc(mpg_z)) |> group_by(cyl) |> filter(row_number()<4) |>
ec.init(ctype='bar', title= list(text='lollypop chart')
    ,grid= list(containLabel=TRUE)
    ,xAxis= list(axisLabel= list(rotate= 66), scale=TRUE,
             axisTick= list(alignWithLabel= TRUE))
    ,yAxis= list(name='mpg_z', nameLocation='center', nameRotate=90, nameGap=20)
    ,barWidth= 3, barGap= '-100%'    # center the bar
) |>
ec.upd({
   scats <- lapply(series, function(bar) {   # set matching scatter serie
      within(bar, {
         type <- 'scatter'
         encode <- list(x='model', y='mpg_z')
         label <- list(show=TRUE, formatter= '{@mpg_z}')
         symbolSize <- 25
         itemStyle <- list(opacity= 1, borderWidth=2, borderColor= 'cornsilk')
      })
   })
   series <- append(series, scats)
}) |> ec.theme('dark-mushroom')
Triple gauge with animation
with two layout examples - dials and rings
jcode <- "setInterval(function () {
    opts.series[0].data[0].value= (Math.random() * 100).toFixed(2) - 0;
    opts.series[0].data[1].value= (Math.random() * 100).toFixed(2) - 0;
    opts.series[0].data[2].value= (Math.random() * 100).toFixed(2) - 0;
    chart.setOption(opts, true);
}, 2000);"

library(echarty)
ec.init(js= jcode,
    series= list(list(type= "gauge",
        anchor= list(show= TRUE, showAbove= TRUE, size= 18, itemStyle= list(color= "#FAC858")),
        pointer= list(icon= "path://M2.9,0.7L2.9,0.7c1.4,0,2.6,1.2,2.6,2.6v115c0,1.4-1.2,2.6-2.6,2.6l0,0c-1.4,0-2.6-1.2-2.6-2.6V3.3C0.3,1.9,1.4,0.7,2.9,0.7z",
                          width= 8, length= "80%", offsetCenter= list(0, "8%")),
        progress= list(show= TRUE, overlap= TRUE, roundCap= TRUE),
        axisLine= list(roundCap= TRUE),
        data= list(
       list(value= 20, name= "One", title= list(offsetCenter= list("-40%", "80%")), detail= list(offsetCenter= list("-40%","95%"))),
       list(value= 40, name= "Two", title= list(offsetCenter= list("0%", "80%")), detail= list(offsetCenter= list("0%", "95%"))),
       list(value= 60, name= "Three", title= list(offsetCenter= list("40%", "80%")), detail= list(offsetCenter= list("40%","95%")))
        ),
        title= list(fontSize= 14),
        detail= list(width= 40, height= 14, fontSize= 14, color= "#fff", backgroundColor= "auto", borderRadius= 3, formatter= "{value}%")
))) |> ec.theme('dark')
# from https://echarts.apache.org/examples/en/editor.html?c=gauge-ring
gaugeData = list(
    list(name='Val1', title=list(offsetCenter=list('0%', '-30%')),
          detail=list(valueAnimation=TRUE,offsetCenter=list('0%', '-20%'))),
    list(name='Val2', title=list(offsetCenter=list('0%', '0%')),
          detail=list(valueAnimation=TRUE,offsetCenter=list('0%', '10%'))),
    list(name='Val3', title=list(offsetCenter=list('0%', '30%')),
          detail=list(valueAnimation=TRUE,offsetCenter=list('0%', '40%'))))
options = lapply(1:3, \(i) {
    gdata = gaugeData;
    for(j in 1:3) {gdata[[j]]$value = round(runif(1) *100) }
    list(
    series= list(list(type='gauge',
        startAngle=90, endAngle=-200, pointer=list(show=FALSE),
        progress= list(show=TRUE,overlap=FALSE,roundCap=TRUE,clip=FALSE,
                          itemStyle=list(borderWidth=1, borderColor='#464646')),
        axisLine= list(lineStyle= list(width=40, opacity=0)),
        splitLine=list(show=FALSE,distance=0,length=10),
        axisTick= list(show=FALSE),axisLabel=list(show=FALSE,distance=50),
        data= gdata,
        title= list(fontSize=14, color='cornsilk'),
        detail= list(width=50,height=14, fontSize=14, color='inherit',
            borderColor='inherit',borderRadius=20,borderWidth=1, formatter='{value}%')
    )) )
} )
ec.init(preset= F,
    options= options,
    timeline= list(axisType='category', data=c(1:3), autoPlay=T)
) |> ec.theme('dark-mushroom')
Bar Race
with timeline
# https://echarts.apache.org/examples/en/editor.html?c=bar-race-country

ROOT_PATH = 'https://echarts.apache.org/examples/data/asset/data/life-expectancy-table.json'
tmp <- jsonlite::fromJSON(ROOT_PATH)
tmp <- tmp[-1,]
countries <- tmp[,4]
tmp <- tmp[,-4]
tmp <- apply(tmp, 2, as.numeric)
df <- as.data.frame(tmp)
df <- df |> mutate(Country=countries)
colnames(df) <- c("Income","Life Expectancy","Population","Year","Country")
startYear <- 1950

# with timeline, no Javascript
updateFrequency <- 2100  # msec
df |> filter(Year >= startYear) |> group_by(Year) |>
ec.init(
    title= list(text='year %@'), grid= list(containLabel=T),
    xAxis= list(max='dataMax'),
    yAxis= list(type='category', inverse=TRUE, max=10, name='',
        axisLabel=list(show=TRUE, fontSize=12),
        animationDuration=300, animationDurationUpdate=300),
    series.param= list(
        type= 'bar', colorBy='data', realtimeSort=TRUE,
        encode= list(x= 1, y= 5),
        label= list(show=TRUE,precision=1,position='right',valueAnimation=TRUE,fontFamily='monospace'),
        animationDuration=0, animationDurationUpdate= updateFrequency,
        animationEasing= 'linear',
        animationEasingUpdate='linear'
    ),
    timeline= list(autoPlay=T, playInterval= updateFrequency/3)
)  |> ec.theme('dark')
Crosstalk 2D
play with the Live
Demo, code included
Crosstalk with leaflet map
two-way selection between map and chart
library(crosstalk)
sdf <- quakes[1:33,] |> SharedData$new(group= 'qk')

library(leaflet)
map <- leaflet(sdf) |> addTiles() |> addMarkers()

library(echarty)
p <- sdf |> ec.init(
   title= list(text= 'Crosstalk two-way selection'),
   toolbox= list(feature= list(brush= list(show=TRUE))),
   brush= list(brushLink='all', throttleType='debounce',
            brushStyle= list(borderColor= 'red')),
   tooltip= list(show=TRUE),
   xAxis= list(scale=TRUE, boundaryGap= c('5%', '5%'))
) |>
ec.upd({
   series[[1]] <- append(series[[1]], list(
      encode= list(x='mag', y='depth', tooltip=list(2,3)),
      selectedMode= 'multiple',
      emphasis= list(
         itemStyle= list(borderColor='yellow', borderWidth=2),
         focus= 'self',
         blurScope='series'
      ),
      blur= list(itemStyle= list(opacity = 0.4))  # when focus set
   ))
}) |> ec.theme('dark-mushroom')

library(htmltools)
browsable(tagList(
   div(style="float:left;width:50%;", map),
   div(style="float:right;width:50%;",p)
))
Check out also the World
Map demo, using ECharts map.
Crosstalk in 3D
# echarty can filter and highlight 3D points selected by external controls
library(crosstalk); library(DT); library(d3scatter);
library(htmltools); library(dplyr); library(tibble)
sdf <- mtcars |> rownames_to_column(var='name') |> relocate(mpg,wt,hp)
sdf <- SharedData$new(sdf)

p3 <- sdf |> ec.init(load= '3D',
   title= list(text="crosstalk 3D listener (filter & selection)"),
   series= list(list(type='scatter3D', symbolSize=11,
      itemStyle= list(color= htmlwidgets::JS("function(params){
              let cyl=params.value[4]; return (cyl==4 ? 'RoyalBlue' : cyl==6 ? 'OrangeRed':'green');}") ),
      emphasis= list(focus='self', blurScope='series', itemStyle= list(color='red'))
   ))
) |> ec.theme('dark-mushroom')

bscols( list(
    d3scatter(sdf, ~mpg, ~wt, ~factor(cyl), width="100%", height=300),br(),
    datatable(sdf, extensions="Scroller", style="bootstrap", class="compact", width="100%",
              options=list(deferRender=TRUE, scrollY=300, scroller=TRUE))
  ),  list( p3, br(), filter_slider("fs1", "mpg", sdf, column=~mpg))
)scatterGL
plugin 3D, test with 5,000 points
# example works also with slower type='scatter', with ec.data(dat, format='values')
# ------ 1) prepare data
library(tibble)
dim <- 2500   # sample data half-quantity, could be much more
slip <- if (dim %% 2) 0.1 else -0.1
setData <- function(offset) {
  t <- tibble(x= runif(dim, max=10),
              y= offset + sin(x) - x * slip * runif(dim))
  round(t,3)
}
# two sets, same data shifted vertically
dat <- rbind(setData(0), setData(1))

# ------ 2) show data
library(echarty)
ec.init(load= '3D', preset= FALSE,
   title= list(text=paste('scatterGL -',nrow(dat),'points + zoom')),
   xAxis= list(show=TRUE),
   yAxis= list(show=TRUE),
   series= list(list(type= 'scatterGL', data= ec.data(dat),
                symbolSize= 3, large=TRUE,
                itemStyle= list(opacity=0.4, color='cyan')
   )),
   dataZoom= list(type='inside',start=50)
) |> ec.theme('dark-mushroom')
scatter3D
plugin 3D with scatter3D
quakes[1:333,] |> mutate(mage= ifelse(mag<5, 4, ifelse(mag<6, 10, 15))) |>
  ec.init(load='3D',
    xAxis3D= list(name= "Lat", scale=TRUE),
    yAxis3D= list(name = "Long", scale=TRUE),
    zAxis3D= list(name = "Depth"),
    series= list(list(type= 'scatter3D', name= "Fiji",
        encode= list(x= 'lat', y= 'long', z= 'depth'),
        symbolSize = ec.clmn(6) #'mage'
    )),
    visualMap= list(
      type = "continuous",
      inRange = list(color = c('green', 'yellow', 'red')),
      dimension = 4, #  dimension x = 1, y = 2, z = 3, mag = 4, station = 5
      text= c(paste('mag\n',max(quakes$mag)), min(quakes$mag)),
      top = 20, calculable= TRUE, precision= 1,
      textStyle= list(color= '#bbb')
    )
  ) |> ec.theme('dark-mushroom')
Bathymetry in 3D
up to 200,000 surface points. Good performance test for
CPU/GPU.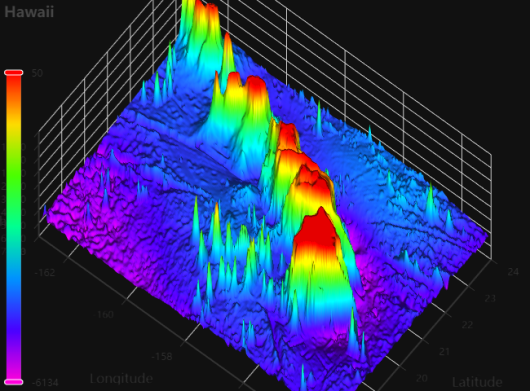
Multiple 3D examples based on ocean floor measurements in different
locations across the planet.
The app requires shiny and several other libraries with their
dependencies - source
code.
run with shiny::runGist(‘https://gist.github.com/helgasoft/121d7d3ff7d292990c3e05cfc1cbf24b’)
Timeline in 3D
demographic data evolution in the last 200 years
# see also original 2D: https://helgasoft.github.io/echarty/uc5.html

# data download and preparation
tmp <- jsonlite::fromJSON('https://echarts.apache.org/examples/data/asset/data/life-expectancy.json')
tmp$series[,,2] <- round(as.numeric(tmp$series[,,2]), 1)  # life exp rounded
tmp$series[,,3] <- round(as.numeric(tmp$series[,,3])/1000000, 2)  # pop in Millions

df <- as.data.frame(tmp$series[1,,])
for(i in 2:nrow(tmp$series)) {
   df <- rbind(df, as.data.frame(tmp$series[i,,]))
}  # convert array to data.frame
colnames(df) <- c('Income','Life','Population','Country','Year')
tt <- df$Country
df <- df[,-4]; df[] <- lapply(df, as.numeric)
df$Country <- tt
df$SymSize <- (sqrt(df$Population / 5e2) + 0.1) *80
df <- df |> relocate(Year, .after= last_col())

# set colors for countries
colors <- rep(c('#8b0069','#75c165', '#ce5c5c', '#fbc357',
    '#8fbf8f', '#659d84', '#fb8e6a', '#c77288', '#786090', '#91c4c5', '#6890ba'), 2)
i <- 0
pieces <- lapply(unique(df$Country), function(x) {
  i <<- i+1;   list(value= x, color= colors[i])
})

df |> group_by(Year) |> ec.init(
   load= '3D',
   timeline= list(
      orient= "vertical",
      autoPlay= TRUE, playInterval= 500, left= NULL, right= 0, top= 20, bottom= 20,
      width= 55, height= NULL, symbol= "none", checkpointStyle= list(borderWidth= 2)
   ),
   series.param= list(
      type= 'scatter3D', #coordinateSystem= 'cartesian3D',
      itemStyle= list(opacity= 0.8),
      encode= list(x= 'Income', y= 'Life', z= 'Year'),
      symbolSize= ec.clmn(5),  # 5 is SymSize
      tooltip= list( backgroundColor= 'transparent',
         formatter= ec.clmn('<b>%@</b><br>life exp: <b>%@</b><br>income: <b>$%@</b><br>populat: <b>%@M</b>',4,2,1,3)
      )
   ),
   title= list(text= "Life expectancy and GDP - year %@", top= 10,
           left= "center", textStyle= list(fontWeight= "normal", fontSize= 20)),
   grid3D=  list(axisLabel= list(textStyle= list(color='#ddd'))),
   xAxis3D= list(name= 'Income', min= 15, axisLabel= list(formatter= "${value}"),
                   nameTextStyle= list(color= '#ddd'), nameGap= 25),
   yAxis3D= list(name= 'Life Expectancy', min= 15,
                   nameTextStyle= list(color= '#ddd')),
   zAxis3D= list(name= 'Year', min= 1790, max=2022,
          nameTextStyle= list(color= '#ddd'), nameGap= 25,
          # minInterval= 1 does not work in 3D, use formatter to show integers for Year
          axisLabel= list(formatter= htmlwidgets::JS("function(val) {if (val % 1 === 0) return val;}"))
   ),
   visualMap= list(show= FALSE, dimension= 'Country', type= 'piecewise', pieces= pieces),
   tooltip= list(show= TRUE)
) |> ec.theme('dark-mushroom')
Radar chart customized
data <- data.frame(
  name= c(3,5,7,8,9),
  values= c(12,45,23,50,32), max= rep(60, 5)
)
# build a list for rich formatting
rifo <- lapply(data$name, function(x) {
  list(height= 30, backgroundColor=list(
      image=paste0('https://raw.githubusercontent.com/googlefonts/noto-emoji/main/png/32/emoji_u1f30',x,'.png')))
})
names(rifo) <- data$name

data |> ec.init(preset= FALSE,
   radar= list(
      indicator= ec.data(data, 'names'),
      name= list(
         formatter= htmlwidgets::JS("v => '{'+v+'| }'"),
         rich= rifo)
   ),
   series= list(list(
      type= 'radar',   data= list(data$values)
   ))
) |> ec.theme('dark-mushroom')
Simple or grouped boxplots
varied methods of boxplot computation and display
# simple boxplots through ec.data ---------------------
ds <- iris |> dplyr::relocate(Species) |>
   ec.data(format= 'boxplot', jitter= 0.1, layout= 'v', symbolSize= 6
)
ec.init(
  dataset= ds$dataset, series= ds$series,xAxis= ds$xAxis, yAxis= ds$yAxis,
  legend= list(show= T), tooltip= list(show= T)
) |>
ec.upd({   # update boxplot serie
  series[[1]] <- c(series[[1]],
     list(color= 'LightGrey', itemStyle= list(color='DimGray', borderWidth=2)))
}) |>
ec.theme('dark-mushroom')
# grouped boxplots through ec.data ---------------------

# mutate to create less Y-axis items with more, sufficient data.
ds <- airquality |> mutate(Day=round(Day/10)) |> relocate(Day,Wind,Month) |> group_by(Month) |>
   ec.data(format='boxplot', jitter=0.1, layout= 'h')
ec.init(
   dataset= ds$dataset, series= ds$series,xAxis= ds$xAxis, yAxis= ds$yAxis,
   legend= list(show= TRUE), tooltip= list(show=TRUE)
) |> ec.theme('dark-mushroom')
# boxplot calculation in R ---------------------
sers <- lapply(list('mpg','hp','disp'), \(cc) {
    list(type='boxplot', name=cc, itemStyle= list(color='gray'),
          data= list(boxplot.stats(unlist(mtcars[cc], use.names=F))$stats))
})
ec.init(
    series= sers,
   xAxis= list(type= 'category'),
   legend= list(show=TRUE)
) |> ec.theme('dark-mushroom')
# boxplot calculation in ECharts, with outliers ---------------------
df <- mtcars[,c(1,3,4)] |> mutate(mpg= mpg*10)
ec.init(
   dataset= list(
      list(source= ec.data(data.frame(t(df)), header=FALSE)),
      list(transform= list(type='boxplot')),
      list(fromDatasetIndex=1, fromTransformResult= 1)),
   series= list(
      list(name= 'boxplot', type= 'boxplot', datasetIndex= 2,
          itemStyle= list(color='lightblue', borderColor= 'violet')),
      list(name= 'outlier', type= 'scatter', encode= list(x=2, y=1), datasetIndex= 3)
   ),
   yAxis= list(type= 'category', boundaryGap=TRUE),
   legend= list(show=TRUE)
) |> ec.theme('dark-mushroom')
Boxplot + scatter overlay
a horizontal chart with zoom and tooltips
Inspired by Julia
Silge’s article. ECharts advantage over ggplot is interactivity -
zoom brush and tooltips.
library(tidyverse)
pumpkins_raw <- readr::read_csv("https://raw.githubusercontent.com/rfordatascience/tidytuesday/master/data/2021/2021-10-19/pumpkins.csv")
pumpkins <-
   pumpkins_raw |>
   separate(id, into= c("year", "type")) |>
   mutate(across(c(year, weight_lbs), parse_number)) |>
   filter(type == "P") |>
   select(country, weight_lbs, year) |>
   mutate(country= fct_lump(country, n= 10))

ds <- ec.data(pumpkins, format='boxplot', jitter=0.1,
   symbolSize= 4, itemStyle=list(opacity= 0.5), name= 'data',
   tooltip= list(
      backgroundColor= 'rgba(30,30,30,0.5)',
      textStyle= list(color='#eee'),
      formatter=ec.clmn('%@ lbs', 1, scale=0))
)
ec.init(
   title= list(
      list(text="Giant Pumpkins", subtext='inspiration',
         sublink='https://juliasilge.com/blog/giant-pumpkins/')
      ,list(text=paste(nrow(pumpkins),'records for 2013-2021'),
         textStyle= list(fontSize= 12), left= '50%', top= '90%' )
   ),
   legend= list(show=TRUE),
   tooltip= list(show=TRUE),
   toolbox= list(left='right', feature=list(dataZoom=list(show= TRUE, filterMode='none'))),
    dataset= ds$dataset, series= ds$series, xAxis= ds$xAxis, yAxis= ds$yAxis
) |> ec.theme('dark-mushroom') |>
ec.upd({
   xAxis[[1]] <- c(xAxis[[1]], list(min=0, nameLocation='center', nameGap=20))
   yAxis[[1]] <- c(yAxis[[1]], list(nameGap= 3))
   series[[1]] <- c(series[[1]], list(color= 'LightGrey', itemStyle= list(color='DimGray')))
   for(i in 2:length(series)) series[[i]]$color <- heat.colors(11)[i-1]
})
Correlation matrix
using heatmap chart
# prepare and calculate data
mtx <- cor(infert %>% dplyr::mutate(education=as.numeric(education)))
order <- corrplot::corrMatOrder(mtx)
mtx <- mtx[order, order]
df <- as.data.frame(as.table(mtx))
for(i in 1:2) df[,i] <- as.character(df[,i])

# ECharts heatmap expects dataset columns in a certain order: relocate
df |> relocate(Var2) |> ec.init(ctype='heatmap',
   title= list(text='Infertility after abortion correlation'),
   xAxis= list(axisLabel= list(rotate=45)),
   visualMap= list(min=-1, max=1, orient='vertical',left='right',
      calculable=TRUE, inRange=list( color=heat.colors(11)) )
) |> ec.theme('dark')
Histogram
using bar chart
do.histogram <- function(x, breaks='Sturges') {
  # get histogram data from input 'x'
  histo <- hist(x, plot=FALSE, breaks)
  tmp <- data.frame(x=histo$mids, y=histo$counts)
  tmp
}
do.histogram(rnorm(44)) |> ec.init(ctype='bar') |> ec.theme('dark')
# with normal distribution line added
hh <- do.histogram(rnorm(44))
nrm <- dnorm(hh$x, mean=mean(hh$x), sd=sd(hh$x))  # normal distribution
ec.init(hh, ctype= 'bar',
   xAxis= list(list(show= TRUE), list(data= c(1:length(nrm)))),
   yAxis= list(list(show= TRUE), list(show= TRUE))
) |> ec.upd({
   series <- append(series, list(
      list(type= 'line', data= nrm,
         xAxisIndex= 1, yAxisIndex= 1, color= 'yellow')))
}) |> ec.theme('dark')
# same with timeline
hh <- data.frame()
for(i in 1:5) {
   tmp <- do.histogram(rnorm(44)) |> mutate(time= rep(i,n()))
   hh <- rbind(hh, tmp)
}
hh |> group_by(time) |>
   ec.init(tl.series= list(type= 'bar', encode= list(x='x',y='y'))) |>
   ec.theme('dark')
Modularity plugin
DOW companies - size by market cap
# click and drag items to see auto-rearrange effect
tmp <- jsonlite::fromJSON('https://quote.cnbc.com/quote-html-webservice/quote.htm?noform=1&partnerId=2&fund=1&exthrs=0&output=json&symbolType=issue&symbols=55991|44503|36276|56858|70258|1607179|84090|142105|145043|148633|151846|167459|174239|178782|174614|197606|202757|205141|205778|212856|228324|260531|277095|81364|283359|10808544|283581|286571|89999|522511530&requestMethod=extended')
df <- tmp$ExtendedQuoteResult$ExtendedQuote$QuickQuote
wt <- data.frame(tic=df$symbol, name=df$altName, bn=NA, size=NA,
      mcap= df$FundamentalData$mktcapView,
      rev= df$FundamentalData$revenuettm)
wt$bn <- round(as.numeric(gsub('M','',wt$mcap, fixed=TRUE))/1000,1) # mkt.cap
bnMax <- max(wt$bn)
wt$size <- 30 + wt$bn/bnMax * 140   # size 30 to 140 px depending on mkt.cap

ec.init(load='gmodular',
   title=list(text='DOW 2021', x='center', y='bottom',
      backgroundColor='rgba(0,0,0,0)', borderColor='#ccc',
      borderWidth=0, padding=5, itemGap=10,
      textStyle=list(fontSize=18,fontWeight='bolder', color='#eee'),subtextStyle=list(color='#aaa')),
   backgroundColor= '#000',
   animationDurationUpdate= "function(idx) list(return idx * 100; )",
   animationEasingUpdate= 'bounceIn',
   series= list(list(
      type= 'graph', layout= 'force',
      force= list(repulsion=250, edgeLength=10),
      modularity= list(resolution=7, sort=TRUE),
      roam= TRUE, label= list(show=TRUE),
      data= lapply(ec.data(wt, 'names'), function(x)
         list(name= x$tic, lname= x$name, value= x$bn,
              symbolSize= x$size, draggable= TRUE
         )) )),
   tooltip= list(formatter= ec.clmn('<b>%@</b><br>%@ bn','lname','value'))
)
Graph
Circular layout diagram for ‘Les Miserables’ characters
# https://echarts.apache.org/examples/en/editor.html?c=graph-circular-layout
les <- jsonlite::fromJSON('https://echarts.apache.org/examples/data/asset/data/les-miserables.json')
les$categories$name <- as.character(1:9)
ec.init(preset=FALSE,
   title=list(text='Les Miserables',top='bottom',left='right'),
   series= list(list(
      type= 'graph', layout= 'circular',
      circular= list(rotateLabel=TRUE),
      nodes= ec.data(les$nodes, 'names'),
      links= ec.data(les$links, 'names'),
      categories= ec.data(les$categories, 'names'),
      roam= TRUE, label= list(position='right', formatter='{b}'),
      lineStyle= list(color='source', curveness=0.3)
   )),
   legend= list(data=c(les$categories$name), textStyle=list(color='#ccc')),
   tooltip= list(show=TRUE),
   backgroundColor= '#191919'
) |> ec.upd({    # labels only for most important
   series[[1]]$nodes <- lapply(series[[1]]$nodes, function(n) {
      n$label <- list(show= n$symbolSize > 30)
      n })
})Custom SVG map
with mouse events
#' JS source https://echarts.apache.org/examples/en/editor.html?c=geo-organ
#' p$x$opts from original 'options' translated with demo(js2r)
#' p$x$on handlers added manually
#' demo also at https://rpubs.com/echarty/svg
url <- 'https://echarts.apache.org/examples/data/asset/geo/Veins_Medical_Diagram_clip_art.svg'
svg <- url |> readLines(encoding='UTF-8') |> paste0(collapse="")
p <- ec.init(preset=FALSE,
    tooltip= list(zz= ""),
    geo= list(left= 10, right= "50%", map= "organs", selectedMode= "multiple",
      emphasis= list(focus= "self", itemStyle= list(color= NULL),
         label= list(position= "bottom", distance= 0, textBorderColor= "#fff", textBorderWidth= 2)),
      blur= list(zz= ""),
      select= list(itemStyle= list(color= "#b50205"),
         label= list(show= FALSE, textBorderColor= "#fff", textBorderWidth= 2))),
    grid= list(left= "60%", top= "20%", bottom= "20%"),
    xAxis= list(zz= ""),
    yAxis= list(data= list("heart", "large-intestine", "small-intestine", "spleen", "kidney", "lung", "liver")),
    series= list(list(type= "bar", emphasis= list(focus= "self"),
                  data= list(121, 321, 141, 52, 198, 289, 139)))
) |> ec.theme('dark-mushroom')
p$x$registerMap <- list(list(mapName= 'organs', svg= svg))
p$x$on <- list(
   list(event='mouseover', query=list(seriesIndex=0),
              handler=htmlwidgets::JS("function (event) {
  this.dispatchAction({ type: 'highlight', geoIndex: 0, name: event.name }); }") ),
   list(event='mouseout', query=list(seriesIndex=0),
              handler=htmlwidgets::JS("function (event) {
  this.dispatchAction({ type: 'downplay', geoIndex: 0, name: event.name }); }") )
)
p
World map plugin
with geo points/lines in a timeline
flights <- read.csv('https://raw.githubusercontent.com/plotly/datasets/master/2011_february_aa_flight_paths.csv')
# set first two columns to longitude/latitude as default for ECharts
df <- head(flights) |> relocate(start_lon,start_lat,end_lon) |>
  group_by(airport1) |> group_split()
# timeline options are individual charts
options <-  lapply(df, function(y) {
  series <- list(
    list(type='scatter', coordinateSystem='geo',
         data= ec.data(y, 'values'), symbolSize= 8),
    list(type='lines', coordinateSystem='geo',
         data= lapply(ec.data(y, 'names'), function(x)
           list(coords= list(c(x$start_lon, x$start_lat),
                              c(x$end_lon, x$end_lat)))
         ),
         lineStyle= list(curveness=0.3, width=2, color='red') )
  )
  list(title=list(text=unique(y$airport1), top=30),
       backgroundColor= '#191919',
       geo= list(map="world", roam=TRUE, center=c(-97.0372, 32.89595), zoom=4),
       series= series)
})

ec.init(preset=FALSE, load='world',
   # timeline labels need to match option titles
   timeline= list(
      data= unlist(lapply(options, function(x) x$title$text)),
      axisType= 'category'),
   options= options
)
Leaflet maps with shape files
demo for GIS points, polylines and polygons
library(sf)
library(spData)  # https://jakubnowosad.com/spData/

xy2df <- function(val) {
  len2 <- length(unlist(val)) /2
  as.array(matrix(unlist(val), len2, 2))
}

# ----- MULTIPOINT -----
nc <- as.data.frame(urban_agglomerations) |> filter(year==2020) |>
  rename(NAME= urban_agglomeration) |>
  select(NAME, country_or_area, population_millions, geometry) |>
  rowwise() |>  # set population as Z
  mutate(geometry= st_sfc(st_point(c(unlist(geometry), population_millions))) )

ec.init(load= c('leaflet'),
    js= ec.util(cmd= 'sf.bbox', bbox= st_bbox(nc$geometry)),
    series= ec.util(df= nc, name= 'Largest Cities', itemStyle= list(color= 'red')
        ,symbolSize= ec.clmn(3, scale=0.5) # urban_agglomerations
    ),
    tooltip= list(formatter= '{a}'), legend= list(show= TRUE), animation= FALSE
)
##
##  series: 1 records: 30
# ----- MULTILINESTRING -----
nc <- as.data.frame( st_transform(seine, crs=4326))
# build animation effect series
sd <- list()
for(i in 1:nrow(nc)) {
   sd <- append(sd, list(
      list(type= 'lines', coordinateSystem= 'leaflet', polyline= TRUE,
         name= nc$name[i], lineStyle= list(width=0), color= 'blue',
         effect= list(show= TRUE, constantSpeed= 80, trailLength= 0.1, symbolSize= 3),
         data= list(list(coords= xy2df(nc$geometry[i]))
   ))))
}
ec.init(load= c('leaflet'),
   js= ec.util(cmd= 'sf.bbox', bbox= st_bbox(nc$geometry)),
   series= append(
      ec.util(df= nc, nid= 'name', lineStyle= list(width= 4), verbose=TRUE),
      sd ),
   tooltip= list(formatter= '{a}'), legend= list(show= TRUE),
   color=c('red','purple','green')
)
## Marne,Seine,Yonne,
##  series: 3 records: 658
# ----- MULTIPOLYGON -----
nc <- as.data.frame(st_transform(nz, crs=4326)) |> rename(geometry= geom)
  attr(nc, 'sf_column') <- 'geometry'

ec.init(load= c('leaflet', 'custom'),  # load custom for polygons
    js= ec.util(cmd= 'sf.bbox', bbox= st_bbox(nc$geometry)),
    series= ec.util(df= nc, nid= 'Name', itemStyle= list(opacity= 0.3)),
    tooltip= list(formatter= '{a}'), animation= FALSE
)
##
##  series: 22 records: 1191
Leaflet maps with geoJson
support for points, polylines and polygons
#' data from https://apidocs.geoapify.com/docs/isolines/#about
#' shows tooltip, opacity, color, fill, etc. for each feature

anim <- "
loc= [[2.32968,48.85948,0],[2.32959,48.85967,0],[2.33026,48.86059,0],[2.33005,48.86097,0],[2.33358,48.86583,0],[2.33421,48.8664,0],[2.33293,48.86935,0],[2.33245,48.87093,0]];
ii= 0; inc= 1;
setInterval( (p) => {
  ii = ii + inc;
  if (ii> 7) { inc= -1; ii--; }
  if (ii< 0) { inc= +1; ii++; }
  loca = loc[ii];
  opt = {series: {id: 'bycicle', data: [loca]} };
  chart.setOption(opt);
}, 633)"
tmp <- jsonlite::fromJSON('https://helgasoft.github.io/echarty/test/bycic.geojson')
cntr <- c(2.329466, 48.859475); nid <- 'id'; zm <- 14

ec.init(
  load= c('leaflet', 'custom'), js=c('','',anim),
  leaflet= list(center= cntr, zoom= zm, roam= T),
  tooltip= list(show=T, formatter='{b}'),
  color= c('green','blue','red'),
  series= append(
    list(
      ec.util(cmd= 'geojson', geojson= tmp,
          colorBy= 'data', ppfill= NULL, nid= nid
    )),
    list(list(   # animated bycicle serie
      type= 'custom',
      coordinateSystem= 'leaflet', id= 'bycicle', zlevel= 11,
      renderItem= htmlwidgets::JS("(params, api) => {
        cc = api.coord([api.value(0), api.value(1)]);
        return {
          type: 'path',
          shape: {
            pathData: 'M4 4.5a.5.5 0 0 1 .5-.5H6a.5.5 0 0 1 0 1v.5h4.14l.386-1.158A.5.5 0 0 1 11 4h1a.5.5 0 0 1 0 1h-.64l-.311.935.807 1.29a3 3 0 1 1-.848.53l-.508-.812-2.076 3.322A.5.5 0 0 1 8 10.5H5.959a3 3 0 1 1-1.815-3.274L5 5.856V5h-.5a.5.5 0 0 1-.5-.5zm1.5 2.443-.508.814c.5.444.85 1.054.967 1.743h1.139L5.5 6.943zM8 9.057 9.598 6.5H6.402L8 9.057zM4.937 9.5a1.997 1.997 0 0 0-.487-.877l-.548.877h1.035zM3.603 8.092A2 2 0 1 0 4.937 10.5H3a.5.5 0 0 1-.424-.765l1.027-1.643zm7.947.53a2 2 0 1 0 .848-.53l1.026 1.643a.5.5 0 1 1-.848.53L11.55 8.623z',
          },
          x: cc[0], y: cc[1],
          originX: 17, originY: 17,
          scaleX: 2, scaleY : 2  // 3 = orig.XY 12
        }
      }"),
      data= list(cntr)
    ))
  )
)
##
## geoJSON has 6 features
Leaflet with heatmap
With fullscreen option in toolbox
df <- quakes |> dplyr::relocate('long')  # set order to lon,lat
tbox <- list(left='center', feature= ec.util(cmd='fullscreen'))

ec.init(load='leaflet',
   toolbox= tbox,
   leaflet= list(center= c(179.462, -20), zoom= 4, roam= TRUE),
   series= list(list(
     type='heatmap',
     data= ec.data(df),
     pointSize= 2, blurSize= 4
   )),
   visualMap= list(
     show= FALSE, top= 'top', min= 0, max= 15,
     calculable= TRUE, inRange= list(color= rainbow(11))
   )
)
World map
with live data, color coding filter, pan/zoom Live
Demo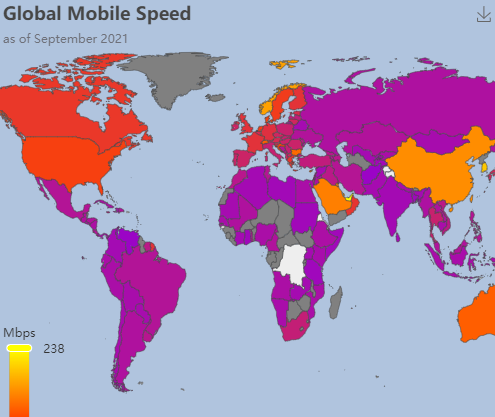
3D Globe
Interactive 3D application with ECharts 3D Globe Live Demo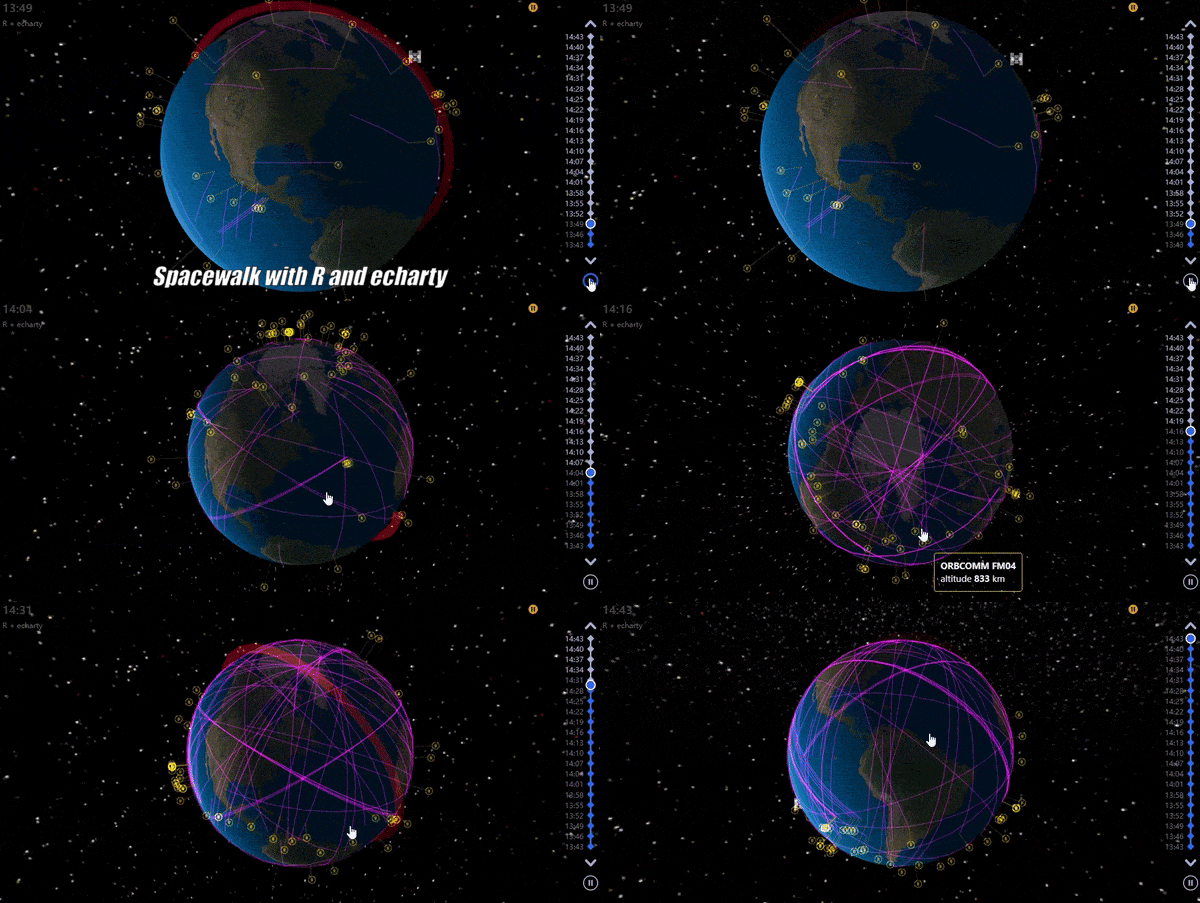
🔻 Features
- real-time satellite data filtered by altitude
- charts: scatter3D for satellite location, bar3D for beams and lines3D for tracks
- controls: hover icons, timeline play/stop, animations toggle, zoom/rotate globe
- published as live demo
Quantiles
Overlay data and quantiles, then identify each with tooltips
# data and inspiration from https://ptarroso.github.io/quantileplot/
set.seed(555)
counts <- 1:25
n <- 50  # original is 250
x <- rep(counts, each=n)
y <- rep(NA, length(x))
for (i in counts) {
  mean.val <- log(i)+1
  sdev.val <- runif(1, 0.2, 0.8)
  y[x==i] <- round(rnorm(n, mean.val, sdev.val), 3)
}
q <- seq(0, 1, 0.025)
mat <- matrix(NA, length(q), length(counts))
for (i in 1:length(counts)) {
  val <- counts[i]
  mat[,i] <- quantile(y[x==val], probs=q)
}
mx <- as.integer(length(q)/2)
colors <- hcl.colors(mx, palette= 'sunset', alpha= 0.9)
dxy <- data.frame(x=x, y=y)
series <- list()
for (i in 1:mx) {
   tmp <- data.frame(x= counts, hi= mat[i,], low= mat[length(q)+1-i,])
   series <- append(series,
      ecr.band(tmp, 'low', 'hi', name=paste0(round((1-q[i]*2)*100),'%'), color=colors[i])
   )
}
series <- append(series,
   list(list(type='scatter', symbolSize= 3, itemStyle= list(color='cyan'),
             tooltip= list(formatter='{c}'))) )

dxy |> ec.init(load='custom', preset=FALSE,
     xAxis= list(show=TRUE), yAxis= list(show=TRUE),
     tooltip= list(formatter= '{a}', backgroundColor= '#55555599',
                     textStyle= list(color='#eee')),
     title= list(text= 'Data + Quantiles + Tooltips + Zoom', subtext= 'inspiration article',
                     sublink= 'https://ptarroso.github.io/quantileplot/'),
     toolbox= list(feature= list(dataZoom=list(show=TRUE), saveAsImage=list(show=TRUE))),
     series= series
) |> ec.theme('dark')
Dendrogram
Vertical/Radial layouts, symbol size for height, values in tooltips
# Hierarchical Clustering dendrogram charts

# JavaScript code for the switch button
jscode <- "() => {
    chart = get_e_charts('ch1');
   opt= chart.getOption();
   optcurr= opt.o2;  // switch options
   opt.o2= null;
   optcurr.o2= opt;
   chart.setOption(optcurr, true);
}"

hc <- hclust(dist(USArrests), "ave")
subt <- paste(as.character(hc$call)[2:3], collapse=' ')

p <- ec.init(elementId= 'ch1') |> ec.theme('dark-mushroom')
option1 <- list(
  title= list(text= 'Radial Dendrogram', subtext= subt),
  tooltip= list(show= TRUE),
  graphic= list(elements= list(
     ec.util(cmd='button', text='switch', js=jscode))),
  series= list(list(
    type= 'tree', data= ec.data(hc, format='dendrogram'),
    roam= TRUE, initialTreeDepth= -1,  # initially show all
    symbolSize= ec.clmn(-1, scale= 0.33),
    # exclude added labels like 'p99', leaving only the originals
    label= list(formatter= htmlwidgets::JS(
      "function(n) { out= /p\\d+/.test(n.name) ? '' : n.name; return out;}")),
    layout= 'radial',
    tooltip= list(formatter= "h={c}"),
    universalTransition= list(enabled= TRUE, delay= 600) # animation
  ))
)
option2 <- within(option1, {
   title <- list(text= 'Orthogonal Dendrogram', subtext= subt)
   series[[1]]$layout <- 'orthogonal'
   series[[1]]$orient <- 'TB'
   series[[1]]$leaves <- list(label= list(
      position= 'middle',   rotate= 90, verticalAlign= 'top', align= 'right' ))
   series[[1]]$label$offset <- c(-12,0)
})
p$x$opts <- option2
p$x$opts$o2 <- option1
p
Lotties are lotta fun
Add animations to charts
# data from https://lottiefiles.com
# plugin by https://github.com/pissang/lottie-parser
json <- 'https://helgasoft.github.io/echarty/js/spooky-ghost.json'
cont <- jsonlite::fromJSON(json, simplifyDataFrame=FALSE)

iris |> dplyr::group_by(Species) |>
ec.init(
  load= 'lottie',
  graphic= list(elements= list(
    list( type= "group",
      # lottie params: info + optional scale and loop
      info= cont, scale= 250, # loop= FALSE,
        left= 'center', top= 'middle' # ,rotation= -20
    ),
    list( type= "image", left= 20, top= 'top',
          style= list(
          image= 'https://www.r-project.org/logo/Rlogo.png',
          width= 150, height= 150, opacity= .4)
   )
  ))
)
Time based charts
use for history, schedules, Gantt, etc. See also live calendar
# data from vistime library
df <- read.csv(text ="start,end,name,position
1789-03-29,1797-02-03,Washington,President
1789-03-29,1797-02-03,Adams,Vice
1797-02-03,1801-02-03,Adams,President
1797-02-03,1801-02-03,Jefferson,Vice
1801-02-03,1809-02-03,Jefferson,President
1801-02-03,1809-02-03,Burr,Vice
1785-05-17,1789-09-26,Jefferson,Minister to France
1789-09-11,1795-01-31,Hamilton,Treasury Secretary
1799-12-14,1800-06-15,Hamilton,Army Chief
") |>
mutate(start= as.Date(start), end= as.Date(end))
ss <- lapply(1:nrow(df), \(i) {
  list(type= 'line',
       name= df$position[i],
       symbolSize= 0,  # to show label
       lineStyle= list(opacity=0.8, width= 44),
       data= list(
         list(df$start[i], df$name[i]),
         list(df$end[i],   df$name[i]) ),
       triggerLineEvent= T,
       tooltip= list(enterable=F, confine=T, formatter='{c} becomes {a}')
  )
})
dd <- read.csv(text ="date,name,event
1826-07-04,Adams,died
1826-07-04,Jefferson,died
1799-12-14,Washington,died
1804-07-11,Burr,killed A.Hamilton in duel
1804-07-11,Hamilton,died
1793-01-21,Jefferson,Louis XVI at the guillotine
1789-07-14,Jefferson,Storming of the Bastille
1804-12-02,Jefferson,Napoleon Emperor
") |> mutate(date= as.Date(date))
s2 <- list(type='scatter', symbolSize=15,
           encode= list(x=1, y=2), z= 22, name= 'Events',
           tooltip= list(formatter=ec.clmn('%@ %@',1,3))
)
s3 <- lapply(list(4,6), \(i) {
  list(type='line',
    lineStyle= list(color= 'red'),
    data= list(
         list(dd$date[i],   dd$name[i]),
         list(dd$date[i+1], dd$name[i+1])) )
})

p <- dd |> ec.init(
  color= list('lightgreen', 'khaki', 'violet', 'lightcoral', 'lightcoral', 'red', 'goldenrod'),
  grid= list(containLabel= T),
  xAxis= list(type= 'time', scale= F, name= 'Year',
      axisLabel= list(showMinLabel= T, showMaxLabel=T,
                      formatter= '{yyyy}')
  ),
    yAxis= list(type= 'category', name='', axisLabel= list(fontSize= 16),
        splitLine= list( show= T, lineStyle= list(color= '#ccc', width= 1))
    ),
    series= append(ss, list(s2)) |> append(s3),
  legend= list(show= T, data=c('President','Vice','Events')),
  tooltip= list(show= T),
  dataZoom= list(start=0, end=60, filterMode= 'none')
) |> ec.theme('dark-mushroom')
p$x$on <- list(list(
  event='mousemove', query='series.line',
  handler=htmlwidgets::JS("function (event) {
    this.dispatchAction({ type: 'showTip',
       seriesIndex: event.seriesIndex, dataIndex:0 });
  }")
))
p 
